
Boosting the performance of solar cells, transistors, LEDs, and batteries will require better electronic materials, made from novel compositions that have yet to be discovered.
To speed up the search for advanced functional materials, scientists are using AI tools to identify promising materials from hundreds of millions of chemical formulations. In tandem, engineers are building machines that can print hundreds of material samples at a time based on chemical compositions tagged by AI search algorithms.
But to date, there’s been no similarly speedy way to confirm that these printed materials actually perform as expected. This last step of material characterization has been a major bottleneck in the pipeline of advanced materials screening.
Now, a new computer vision technique developed by MIT engineers significantly speeds up the characterization of newly synthesized electronic materials. The technique automatically analyzes images of printed semiconducting samples and quickly estimates two key electronic properties for each sample: band gap (a measure of electron activation energy) and stability (a measure of longevity).
The new technique accurately characterizes electronic materials 85 times faster compared to the standard benchmark approach. It is detailed in a study appearing in Nature Communications.
The researchers intend to use the technique to speed up the search for promising solar cell materials. They also plan to incorporate the technique into a fully automated materials screening system that could run 24-7 making and characterizing predicted materials until it arrives at the desired solution.
Once a new electronic material is synthesized, the characterization of its properties is typically handled by a “domain expert” who examines one sample at a time using a benchtop tool called a UV-Vis, which scans through different colors of light to determine where the semiconductor begins to absorb more strongly. This manual process is precise but also time-consuming: A domain expert typically characterizes about 20 material samples per hour—a snail’s pace compared to some printing tools that can lay down 10,000 different material combinations per hour.
To speed up the characterization process and clear one of the largest bottlenecks in materials screening, researchers looked to computer vision—a field that applies computer algorithms to quickly and automatically analyze optical features in an image.
The team realized that certain electronic properties—namely, band gap and stability—could be estimated based on visual information alone, if that information were captured with enough detail and interpreted correctly.
With that goal in mind, the researchers developed two new computer vision algorithms to automatically interpret images of electronic materials: one to estimate band gap and the other to determine stability.
The first algorithm processes visual data from highly detailed, hyperspectral images. Instead of a standard camera image with three channels—red, green, and blue (RBG)—the hyperspectral image has 300 channels. The algorithm takes that data, transforms it, and computes a band gap, a process that is run extremely fast.
The second algorithm analyzes standard RGB images and assesses a material’s stability based on visual changes in the material’s color over time. The team found that color change can be a good proxy for degradation rate in the material system studied.
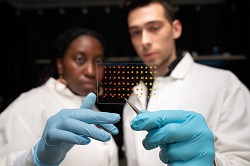
The team applied the two new algorithms to characterize the band gap and stability for about 70 printed semiconducting samples. They used a robotic printer to deposit samples on a single slide, like cookies on a baking sheet. Each deposit was made with a slightly different combination of semiconducting materials. In this case, the team printed different ratios of perovskites—a type of material that is expected to be a promising solar cell candidate, though it is also known to quickly degrade.
Once they printed 70 different compositions of perovskite samples on a single slide, the team scanned the slide with a hyperspectral camera. Then they applied an algorithm that visually “segments” the image, automatically isolating the samples from the background. They ran the new band gap algorithm on the isolated samples and automatically computed the band gap for every sample. The entire band gap extraction process took about six minutes.
Normally, it would take a domain expert several days to manually characterize the same number of samples.
To test for stability, the team placed the same slide in a chamber in which they varied the environmental conditions, such as humidity, temperature, and light exposure. They used a standard RGB camera to take an image of the samples every 30 seconds over two hours. They then applied the second algorithm to the images of each sample over time to estimate the degree to which each droplet changed color, or degraded under various environmental conditions. In the end, the algorithm produced a “stability index,” or a measure of each sample’s durability.
As a check, the team compared their results with manual measurements of the same droplets, taken by a domain expert. Compared to the expert’s benchmark estimates, the team’s band gap and stability results were 98.5% and 96.9% as accurate, respectively, and 85 times faster.
For more information:
Massachusetts Institute of Technology