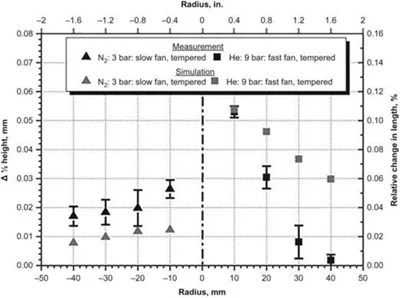

The comparison of the change in length, e.g. after hardening and tempering, is the next step in the model validation. The figure shows the comparison in the change in length of the cylinder. In the left part the change in length after hardening with nitrogen and additional tempering is shown; in the right part one can see the effect of a more rapid hardening with helium and additional tempering. More important is the fact that the model very well describes the tendency of distortion with a maximum in the center of the cylinder and higher values for the helium quenching.
For more information, click on the link below (subscription required). Then scroll to Figure 17. R Schneider; R. Mesquita; W Schützenhöfer, Distortion in Tool Steels, ASM International, 2014 https://doi.org/10.31399/asm.hb.v04d.a0005980