
An important aspect of powder manufacture is the particle size distribution. This aspect of powder technology is often referred to as classification, because powders are broken up into various groupings. Hence, a powder class is also referred to as a powder cut. The most common method of separating powders into their size fractions is by sieving. Sieving can be used either as a diagnostic method to determine the powder quality or as a manufacturing method to select powders of a specific size distribution.
Mesh refers to the screening medium. The openings of the mesh are designed to be uniform in size and shape. The mesh can be made from woven textiles or wires as well as punched or electrodeposited material.
A sieve incorporates the mesh into a physical frame that can vary in size from 10 cm to 1 m (4 in. to 3.3 ft) in diameter or have a rectangular footprint of 2 by 1 m (6.5 by 3.3 ft). The sieve frame is commonly made from brass for test sieves and of stainless steel for production sieving operations.
Sieving can be carried out under wet or dry conditions. Under wet sieving, there is the need to separate the particulates from the fluid medium. There are also processes that use air classification, which works on the principle of centrifugal separation. Air classification is most popular for fine particles that are less than 30 μm (1.2 mils) in diameter, because it is more difficult to manufacture rigid sieves of fine mesh sizes.
The sieve number refers to the number of wires per linear inch. Thus, a sieve number of, for example, 200 indicates that there are 200 openings per inch. The approximate size of this opening will be 1/200 in. However, when the diameter of the actual wire that forms the mesh is taken into account, then it will be observed that the opening will be less than 1/200 in.
The sieve with the largest holes (or largest mesh openings) is placed on the top of a sieve stack.
The order of the sieves should follow the ASTM International specification, where the mesh openings of two consecutive sieves have a 1.414 (i.e., the square root of 2) ratio. A typical sieve stack may classify particles according to the following six micrometer ranges: +300 (oversize), −300 +150, −150 +106, −106 +74, −74 +45, −45 (fines or undersize).
The particle fractions are, for example, stated as “minus 300, plus 150,” which indicates that the powder fell through the 300 μm mesh but was retained on the 150 μm mesh. The powder is fed into the top sieve, and the assembly is vibrated or shaken. The particle size distribution is determined by weighing the amounts of powder in each sieve. The result is usually stated as a percent weight fraction, although some scientific studies find number fractions more useful.
There are several major steps necessary in performing a particle size analysis for a feedstock that is used in thermal spray. First, a representative sample of the feedstock is obtained, making sure that the sample is homogeneous. Feedstocks will become segregated during transportation, and therefore, it is common practice to homogenize them by placing the feedstock bottle on a rolling device so that mixing takes place. Note that the sample size must be suitable for the technique that is employed to measure its characteristics; that is, the sample may be of the order of 50 to 100 g for a sieve analysis but only of the order of a gram for evaluation by means of a light-scattering method. The next major step is to perform the actual test and then arrange the data into a format so that it can be presented in either tabular or graphical form.
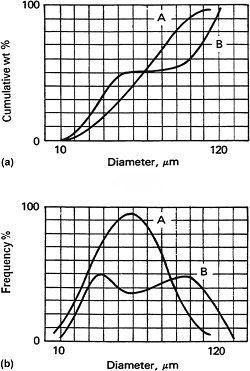
The particle size distribution can be graphically represented as a cumulative plot (image a) or as a frequency plot (image b). These graphs can be derived from each other. That is, the summation of the individual frequencies at each size enables the ve plot to be ascertained. The key features conveyed from particle-size distribution data are as follows:
- The most commonly occurring particle size (i.e., the mode value) is indicated by the peak in the frequency plot. The mean value can be ascertained from the diameter at the 50 wt% value of the cumulative graph.
- The sharpness of the plot provides a qualitative indication of the spread in the particle size. A sharp peak (for example, powder A in image b) indicates that the particles have a similar size, whereas a flat or broad curve (powder B in image b) indicates that the particle sizes are spread over a range of values.
- The maximum and minimum values in measurable diameters allow the particle size range to be determined.
- It is important to look for a distribution that does not fluctuate, because this is indicative of a bimodal distribution of particle sizes. Such powders, that is, powder B in the image, will not feed reliably because it is difficult to adjust the spray parameters to suit both of the particle size peaks.
Image – Particle classification curves. (a) Cumulative. (b) Frequency.
This information is from ASM Handbooks Online, Vol. 5A: Thermal Spray Technology, Coating Structures, Properties, and Materials. To find this information (subscription required), click on the link below and scroll down to Figure 15.
https://dl.asminternational.org/handbooks/edited-volume/12/chapter/133823/Feedstock-Material-Considerations-for-Thermal